

🔓 100% Open Source & Self-Hosted — AGPLv3 License

Unified Observability
at Scale

Explore Your Data With Freedom

XplurData is a free, open-source observability platform — centralizing logs, traces, and metrics into one powerful analytics stack. Deploy on your own infrastructure, no lock-in, no license fees.

AGPLv3 License Open Source License
OpenTelemetry Native Collection
Apache Doris Analytics Backend
Docker Ready One-Command Deploy
Observability Logs
Demo ⏱ May 26 14:20 → May 29 16:16   Kolkata ▾ ↻ Refresh ▾
Filters +
Smart Query  e.g. service_name="kafka"
Match / Match Any ▾ ⊘ Hide chart
Service Inventory-Service 2.2K Api-Gateway 2.1K Auth-Service 2.1K Notification-Service 2.1K Payment-Service 2.1K
Severity Info 7.4K Warning 1.6K Error 1K Debug 522
• Total
6.0k4.5k3.0k1.5k0
🔍 Filter table data... ⬇ Export
TIMESTAMP ↓BODYSERVICE NAMEINSTANCE IDTRACE ID
1 – 500 of 10,499 logs Rows 500 ▾   ‹‹ ‹ 1 2 3 4 5 › ››
New module
Traces

Track request lifecycles and latency across distributed services.


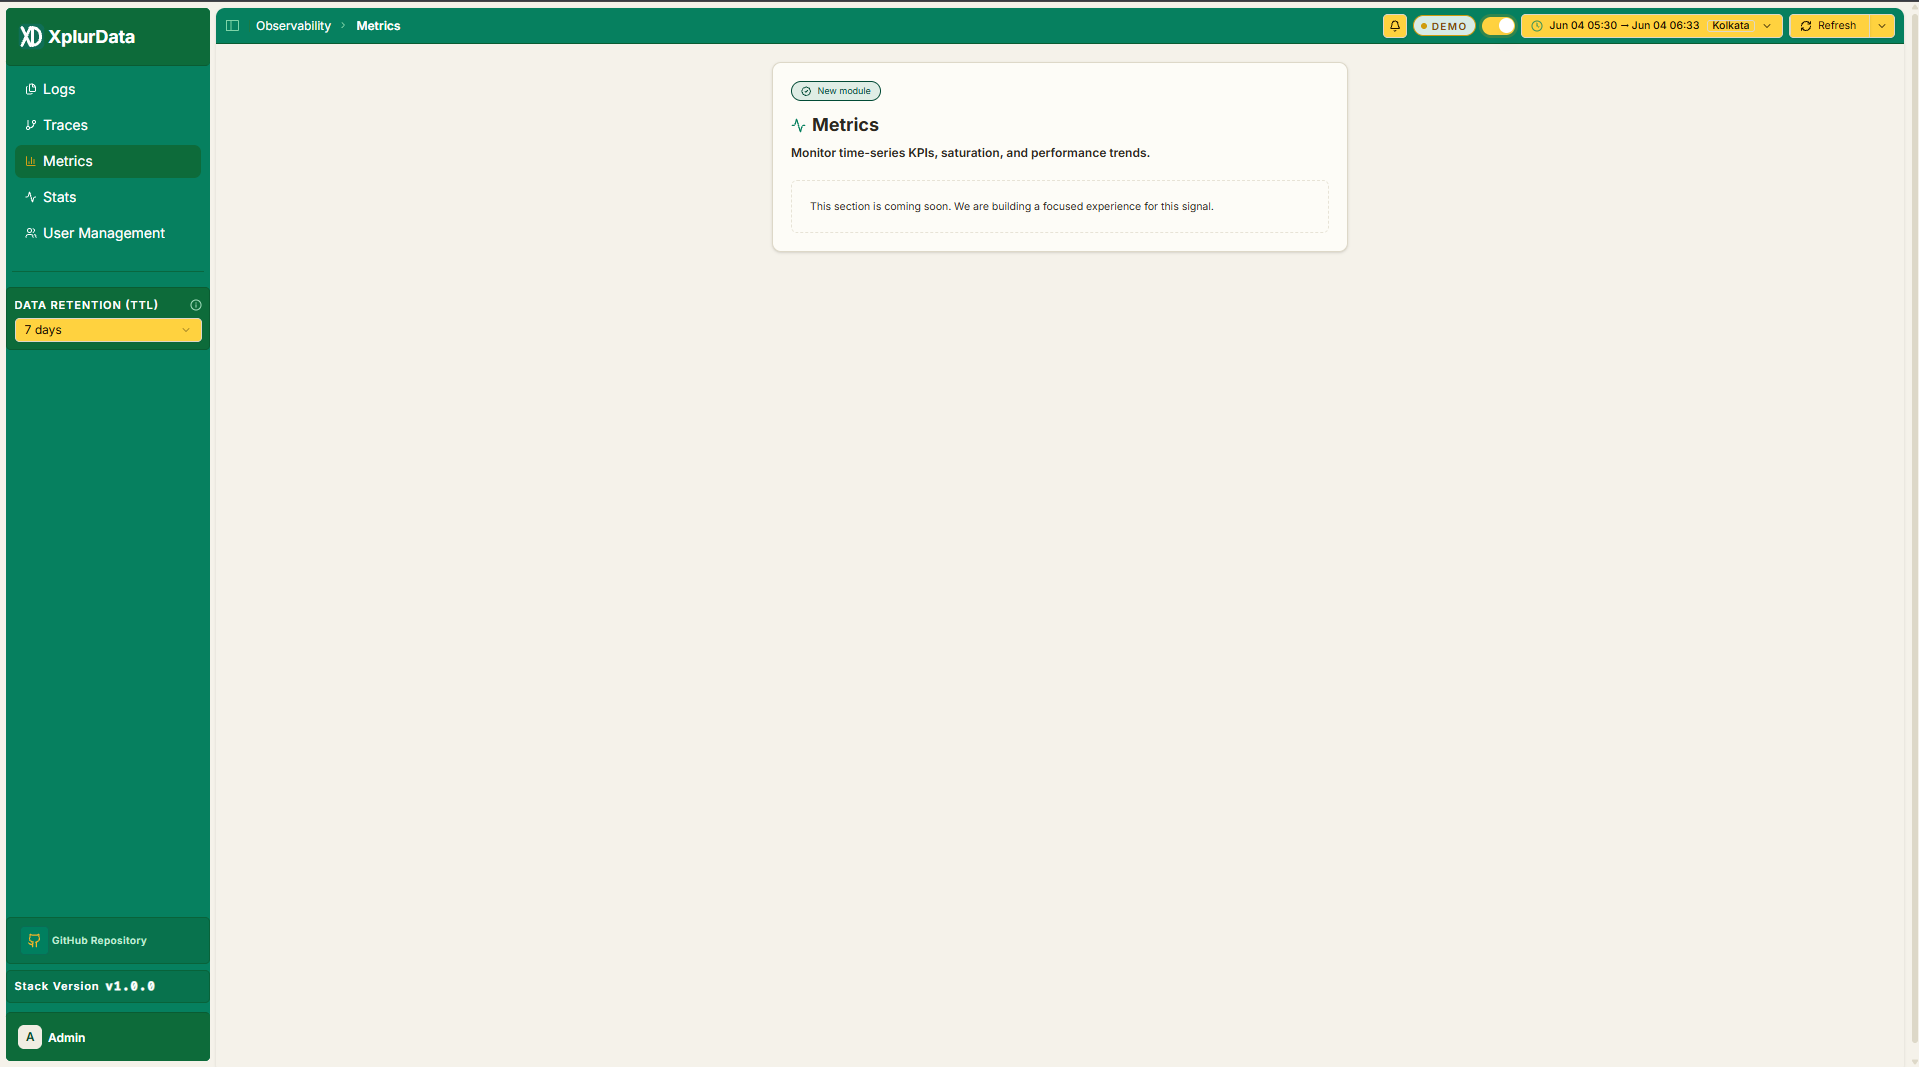
This section is coming soon. We are building a focused experience for this signal.

New module
Metrics

Monitor time-series KPIs, saturation, and performance trends.


This section is coming soon. We are building a focused experience for this signal.

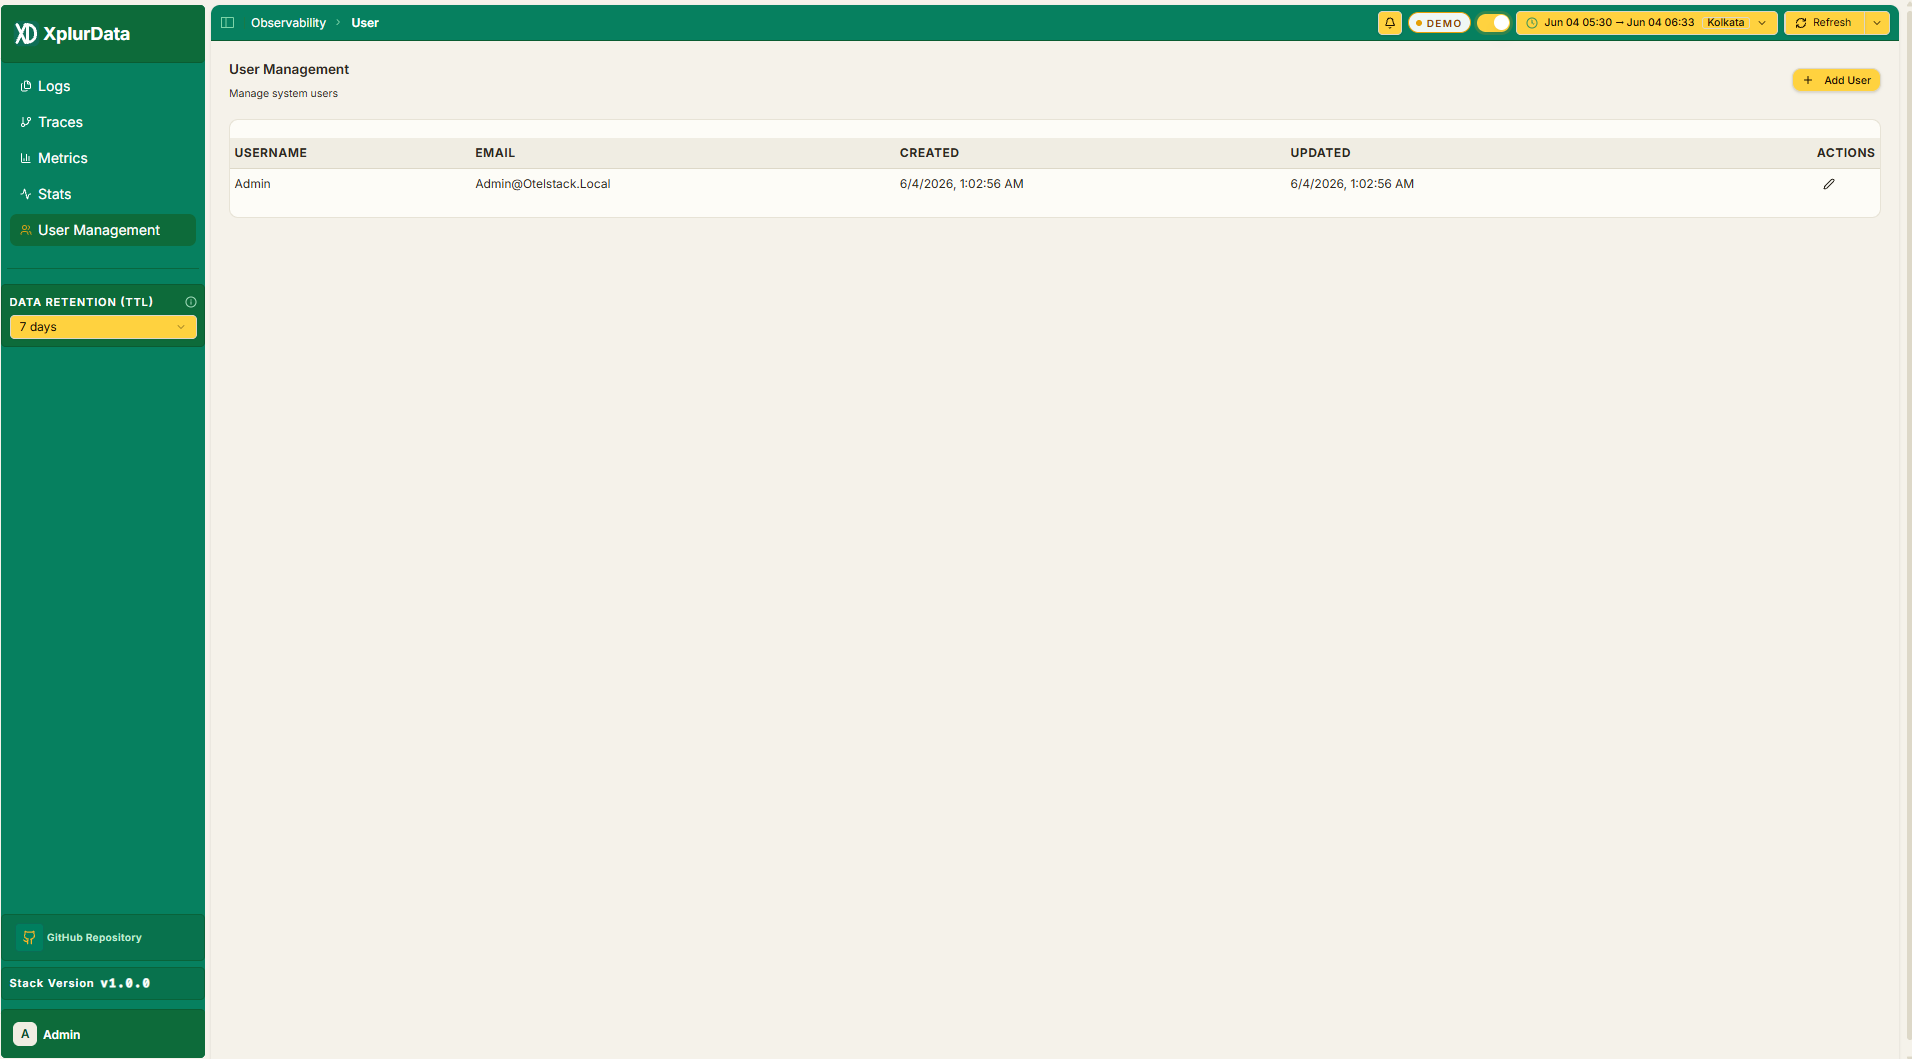
User Management
Manage system users
USERNAMEEMAILCREATEDUPDATEDACTIONS
AdminAdmin@Otelstack.Local5/26/2026, 2:48:35 PM5/26/2026, 2:48:35 PM
ObsObs@Obs.Live5/29/2026, 10:55:05 AM5/29/2026, 10:55:05 AM
Scroll to explore

Everything you need for
modern observability

A complete platform built for engineering and operations teams who need clarity, speed, and control over their systems.

Log Observability

Log Observability enables teams to gain deep visibility into system behavior by collecting, analyzing, correlating, and searching logs in real time to detect issues, investigate incidents, and optimize performance.

  • Granular Detail of logs
  • Event Driven Data
  • Structured Logging
  • One DataStore

Smart Log Explorer

Write Smart queries, apply multi-dimensional filters (service, severity, host, time, etc.), and see results in a compact, sortable table — all in real time.

  • Smart query editor with syntax highlighting
  • Severity badges: INFO, WARN, ERROR, DEBUG
  • Time range picker & live refresh
  • Charts for log volume over time

Free Text Search

Search logs using Apache Doris Free Text Search capabilities and BM25 filter

  • Match, Match ALL
  • Match Any
  • Match Phrase
  • Match Phrase Prefix
  • Match Phrase Edge
  • Match Regexp

User Management

Panel for creating, editing, and removing users with standard Admin access.

Data Export

Export query results as CSV, TSV, XLS directly from the Explorer. Column visibility and ordering controls let you shape your exports precisely.

Demo

Interact with the live demo to explore features and functionality.

NEW

Pattern Explorer (NEW)

Automatically group similar log messages into reusable patterns using the Drain3 clustering algorithm.

  • Drain3 Pattern Clustering
  • Error Pattern Detection
  • Pattern Drill-down
  • Severity Distribution
  • Similarity Tuning
NEW

Data Quality (NEW)

Measure the health of your telemetry by continuously evaluating data quality

  • OTel Quality Score
  • A–F Grade
  • Missing Fields Detection
  • Freshness Monitoring
  • Cardinality Analysis

How it all fits together

A modular, containerized architecture — every component is independent and scalable.

01 Data Sources
Apps Web · Mobile
Services Docker · K8s
Infra Hosts · DBs
OTLP · gRPC
SQL Ingest
03 Storage & API
Doris FE Query Router
XplurData
XD API XplurData Core
Core
Doris BE Analytics Store
REST · WS
Telemetry Flow (OTLP)
·
SQL Ingestion
·
REST / WebSocket
·
Core Component

Built for power users

A clean, modern interface designed to surface insight fast — with the depth engineers demand.

http://localhost/xplur/logs
XplurData Log Explorer

Smart Log Explorer

Write Smart queries, apply multi-dimensional filters (service, severity, host, time, etc.), and see results in a compact, sortable table — all in real time.

Live Logs Granular Detail of logs Event Driven Data Free Text Search BM25 Filter
http://localhost/xplur/traces
XplurData Traces

Distributed TracesComing soon

A dedicated Traces view for tracking full request lifecycles and latency across all your distributed services. Built on top of OTEL span data already flowing in.

In Development OTEL Native
http://localhost/xplur/metrics
XplurData Metrics

Metrics Explore Coming soon

Time-series KPI monitoring, saturation charts, and performance trend visualizations. The OTEL Collector is already ingesting metric data, the UI is next.

In Development Time-Series KPIs
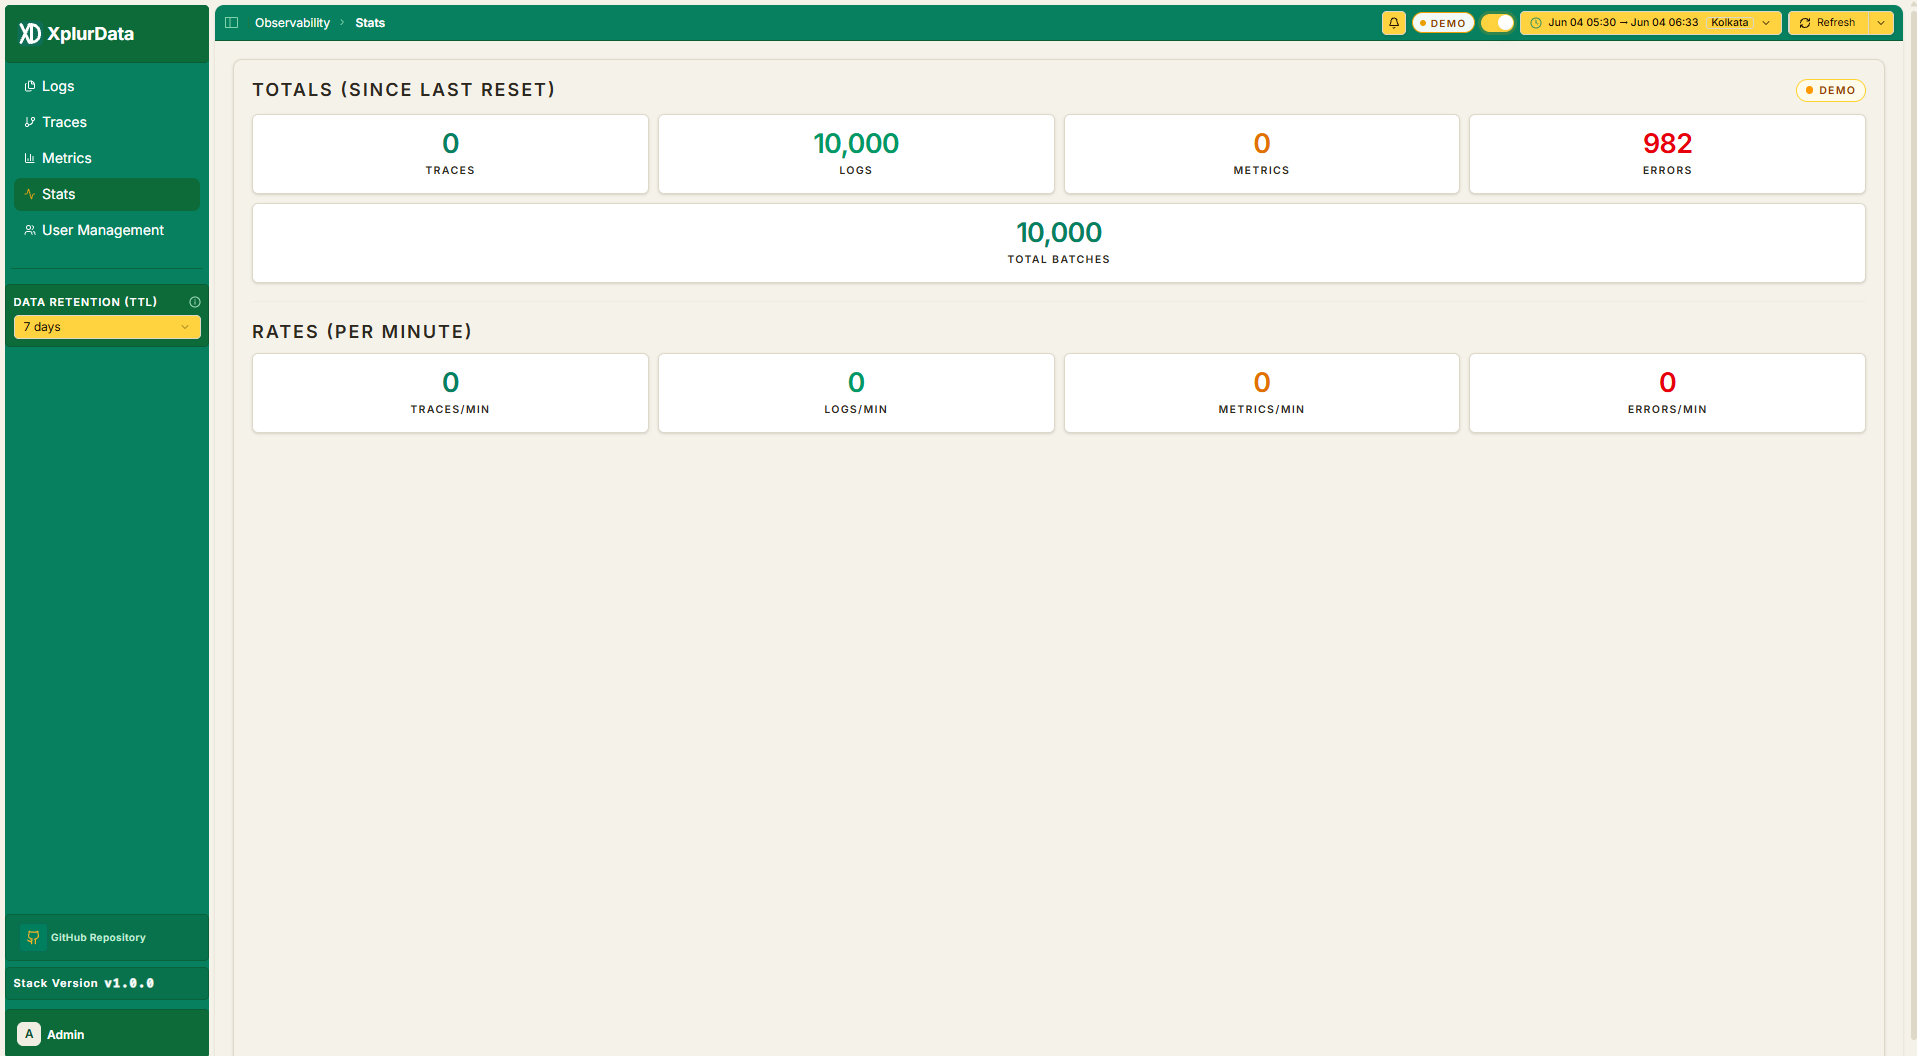
http://localhost/xplur/stats
XplurData stats Management

Stats

Full user administration with role-based access control. Admins can add, edit, or remove users.

Role-Based Access Admin Protected
http://localhost/xplur/users
XplurData User Management

Admin User Management

Full user administration with role-based access control. Admins can add, edit, or remove users.

Role-Based Access Admin Protected

Where we're headed

Transparent, community-driven development. Vote on what matters most to you.

Version 1.0 Completed

Foundation

  • Smart Query Editor
  • Visual Log Classification
  • Flexible Time-Based Analysis
  • Log Activity Analytics
  • Free Text Search
  • Basic Authentication & User Management
  • One-Click Data Export
Version 1.1.0 Completed

Observability Core

  • Relevance-Based Search Ranking (BM25)
  • Log Pattern Analyser
  • Real-Time Incident Detection
  • Advanced Metrics Exploration
  • Distributed Trace Analytics
  • Full-Stack Application Observability
  • Unified Observability Dashboards

Up and running in minutes

Two steps to a fully running OSS observability stack — follow the on-screen instructions after each command.

01

Install the OSS Stack

Run the command below and follow the on-screen instructions to set up the full observability stack automatically.

bash
bash -c "$(curl -fsSL \
  https://raw.githubusercontent.com/xplurdata/oss-stack/main/install.sh)"
02

Generate Real Telemetry Data

Once the stack is installed, populate it with live telemetry data using the OpenTelemetry load generator.

bash
docker run --rm \
  --network xd-oss-stack_otel-net \
  ghcr.io/open-telemetry/opentelemetry-collector-contrib/telemetrygen:latest \
  logs \
  --otlp-endpoint otel-collector:4318 \
  --otlp-http --otlp-insecure \
  --duration 10s \
  --rate 100 \
  --service my-service
Sends 100 logs/sec for 10s across 2 workers to the OTEL collector.
03

Instrument Your Application Logs

Send telemetry from your own app directly to XplurData using the OpenTelemetry SDK. Works with any language — Python, Node.js, Java, Go, and more.

python
# Install
pip install opentelemetry-sdk opentelemetry-exporter-otlp

# logs.py
import logging
from opentelemetry._logs import set_logger_provider
from opentelemetry.sdk._logs import LoggerProvider, LoggingHandler
from opentelemetry.exporter.otlp.proto.http._log_exporter import OTLPLogExporter

provider = LoggerProvider()
provider.add_log_record_processor(
    BatchLogRecordProcessor(
        OTLPLogExporter(
            endpoint="http://<YOUR_HOST>:4318/v1/logs"
        )
    )
)

set_logger_provider(provider)

logger = logging.getLogger("my-service")
logger.addHandler(LoggingHandler(logger_provider=provider))
logger.info("Hello from my-service!")
Node.js
// Install
npm install @opentelemetry/sdk-logs @opentelemetry/exporter-logs-otlp-http

// logs.js
const { LoggerProvider } =
require('@opentelemetry/sdk-logs')

const provider =
new LoggerProvider()

provider.addLogRecordProcessor(
  new BatchLogRecordProcessor(
    new OTLPLogExporter({
      url: 'http://<YOUR_HOST>:4318/v1/logs'
    })
  )
)

const logger =
provider.getLogger('my-service')

logger.emit({
  severityText: 'INFO',
  body: 'Hello from my-service!'
})
java
# Download OpenTelemetry Java Agent
wget https://github.com/open-telemetry/opentelemetry-java-instrumentation/releases/latest/download/opentelemetry-javaagent.jar

# Run your app
java \
-javaagent:opentelemetry-javaagent.jar \
-Dotel.service.name=my-service \
-Dotel.logs.exporter=otlp \
-Dotel.exporter.otlp.endpoint=http://<YOUR_HOST>:4318 \
-jar app.jar

log.info("Hello from my-service!");
go
// Install
go get go.opentelemetry.io/otel

// main.go
exporter, _ := otlploghttp.New(
    ctx,
    otlploghttp.WithEndpoint(
      "<YOUR_HOST>:4318",
    ),
)

provider := sdklog.NewLoggerProvider(
    sdklog.WithProcessor(
        sdklog.NewBatchProcessor(exporter),
    ),
)

logger := provider.Logger(
    "my-service",
)

logger.Emit(ctx, sdklog.Record{
    Body: sdklog.StringValue(
      "Hello from my-service!",
    ),
})
Replace <YOUR_HOST> with your server IP. The OTEL Collector listens on port 4318 (HTTP) and 4317 (gRPC).

Why XplurData?

01

Unified Observability

Centralizes logs, traces, and metrics into one platform. No more tool sprawl — one place to query everything.

02

Enterprise Scale

Apache Doris handles billions of events with sub-second query latency. Built for production workloads from day one.

03

Developer UX

SQL-powered queries, customizable columns, dark mode, saved views. Built by engineers, for engineers.

04

Easy Deployment

Docker Compose for local and production. All services containerized with separate configs and Dockerfiles.

05

Extensible API

RESTful API-first design. Add new endpoints for traces, metrics, or any custom data source in minutes.

06

Security Built-In

JWT auth, HTTP-only cookies, role-based access control, and CSRF mitigation — secure from the start.

07

Faster Root Cause Analysis

Move seamlessly from high-level patterns to individual log events with full service, severity, trace, and span context.

08

Pattern Explorer

Automatically cluster millions of logs into meaningful patterns using Drain3 to uncover recurring failures and reduce investigation time.

Observability & Analytics Blog

Expert articles on scaling open source observability using native OTel collectors and Apache Doris backend storage.

Open Source July 18, 2026

Why We Built a Free OpenTelemetry (OTel) Observability Platform on Apache Doris

Traditional observability platforms charge high fees based on data volume. Discover how combining a native OTel collector with Apache Doris gives you a free, self-hosted, scalable tool with sub-second query performance.

Read Article
Architecture July 10, 2026

Open Source Observability Tool Checklist: Finding the Perfect Stack

Evaluating open source tools for logging, tracing, and metrics? Learn why native OpenTelemetry compliance, index-free scaling, and a free open-source database back-end are critical features for modern cloud platforms.

Read Article
Deployment Guide June 28, 2026

Setting Up Native OTel Log and Trace Storage with Zero Cost

A step-by-step tutorial on deploying the XplurData platform container. Learn how to configure your OpenTelemetry config YAML, map Doris schemas, and start debugging system bottlenecks for free.

Read Article

Start observing your systems
today

XplurData is open and ready to deploy. Built for teams who need real observability without the complexity of commercial platforms.

terminal
$ bash -c "$(curl -fsSL install.sh)"
Fetching OSS stack installer...
Pulling doris-fe image...
Pulling doris-be image...
Pulling otel-collector...
Starting otel-doris-stack_otel-net...
Stack running at http://localhost:3000
✓ Installation complete. Now run telemetrygen to load data.

Frequently Asked Questions

Everything you need to know about our free, open source OpenTelemetry observability platform.

What is XplurData and is it a free observability tool?

XplurData is a 100% free and open source observability platform designed to aggregate and visualize logs, traces, and metrics. Because it is self-hosted and released under the AGPLv3 license, you can install the platform directly on your own infrastructure with zero license fees, making it a robust alternative to expensive proprietary tools.

Why does XplurData use Apache Doris as the backend database?

Apache Doris is a high-performance real-time analytical database. Traditional open-source observability platforms struggle to scale and quickly query billions of trace spans and log entries. Doris offers extremely high data compression, massively parallel processing (MPP), and sub-second query latency, allowing XplurData to run lightning-fast searches over massive datasets.

Does the platform support native OpenTelemetry (OTel) protocols?

Yes. XplurData is built on native OpenTelemetry integrations. Instead of deploying custom proprietary agents on your hosts, you configure standard OTel Collector pipelines to stream telemetry directly to XplurData APIs. This avoids vendor lock-in and lets you leverage the entire OTel ecosystem of instrumentation libraries.

How does XplurData compare to commercial observability platforms?

Most commercial platforms charge based on ingestion volume (e.g., gigabytes per day), creating unpredictable billing spikes. XplurData is a completely free open source tool. Since you host the platform yourself, you only pay for your own basic compute and storage resources, keeping cost consistent and highly predictable.

How easy is it to deploy the XplurData stack?

It is incredibly easy. We provide a single-command installer script that configures and launches Docker containers for Apache Doris (Frontends and Backends), the OpenTelemetry Collector, and the XplurData application server. The platform can be running locally or on a cloud virtual machine in under 5 minutes.

Is there an open source community supporting XplurData?

Yes. Our codebase is hosted on GitHub, and we welcome contributions, feature requests, and issue reports. We also have a community Slack channel where developers and system administrators collaborate on setting up OTel architectures, Doris tuning, and custom observability dashboards.

We'd love to hear from you

XplurData is open source and community-driven. Connect with us through any of the channels below.

Connect with the team

Whether you have a question, want to contribute, or just want to say hi — we're active across GitHub, LinkedIn, Slack and more. Pick the channel that works best for you.

Open Source Community

XplurData is built in the open. Contribute code, report bugs, improve docs, or just share feedback — every contribution matters.

🔓 AGPLv3 License

100% Free & Open Source

XplurData is AGPLv3-licensed. Use it, fork it, build on it — no strings attached. Self-host on your own infrastructure with full control over your data.

AGPLv3 Open Source License
100% Self-Hostable
OTEL Native Protocol
Docker One-Command Deploy